Emma Story
IMG_1307.jpg

The Perception Gap

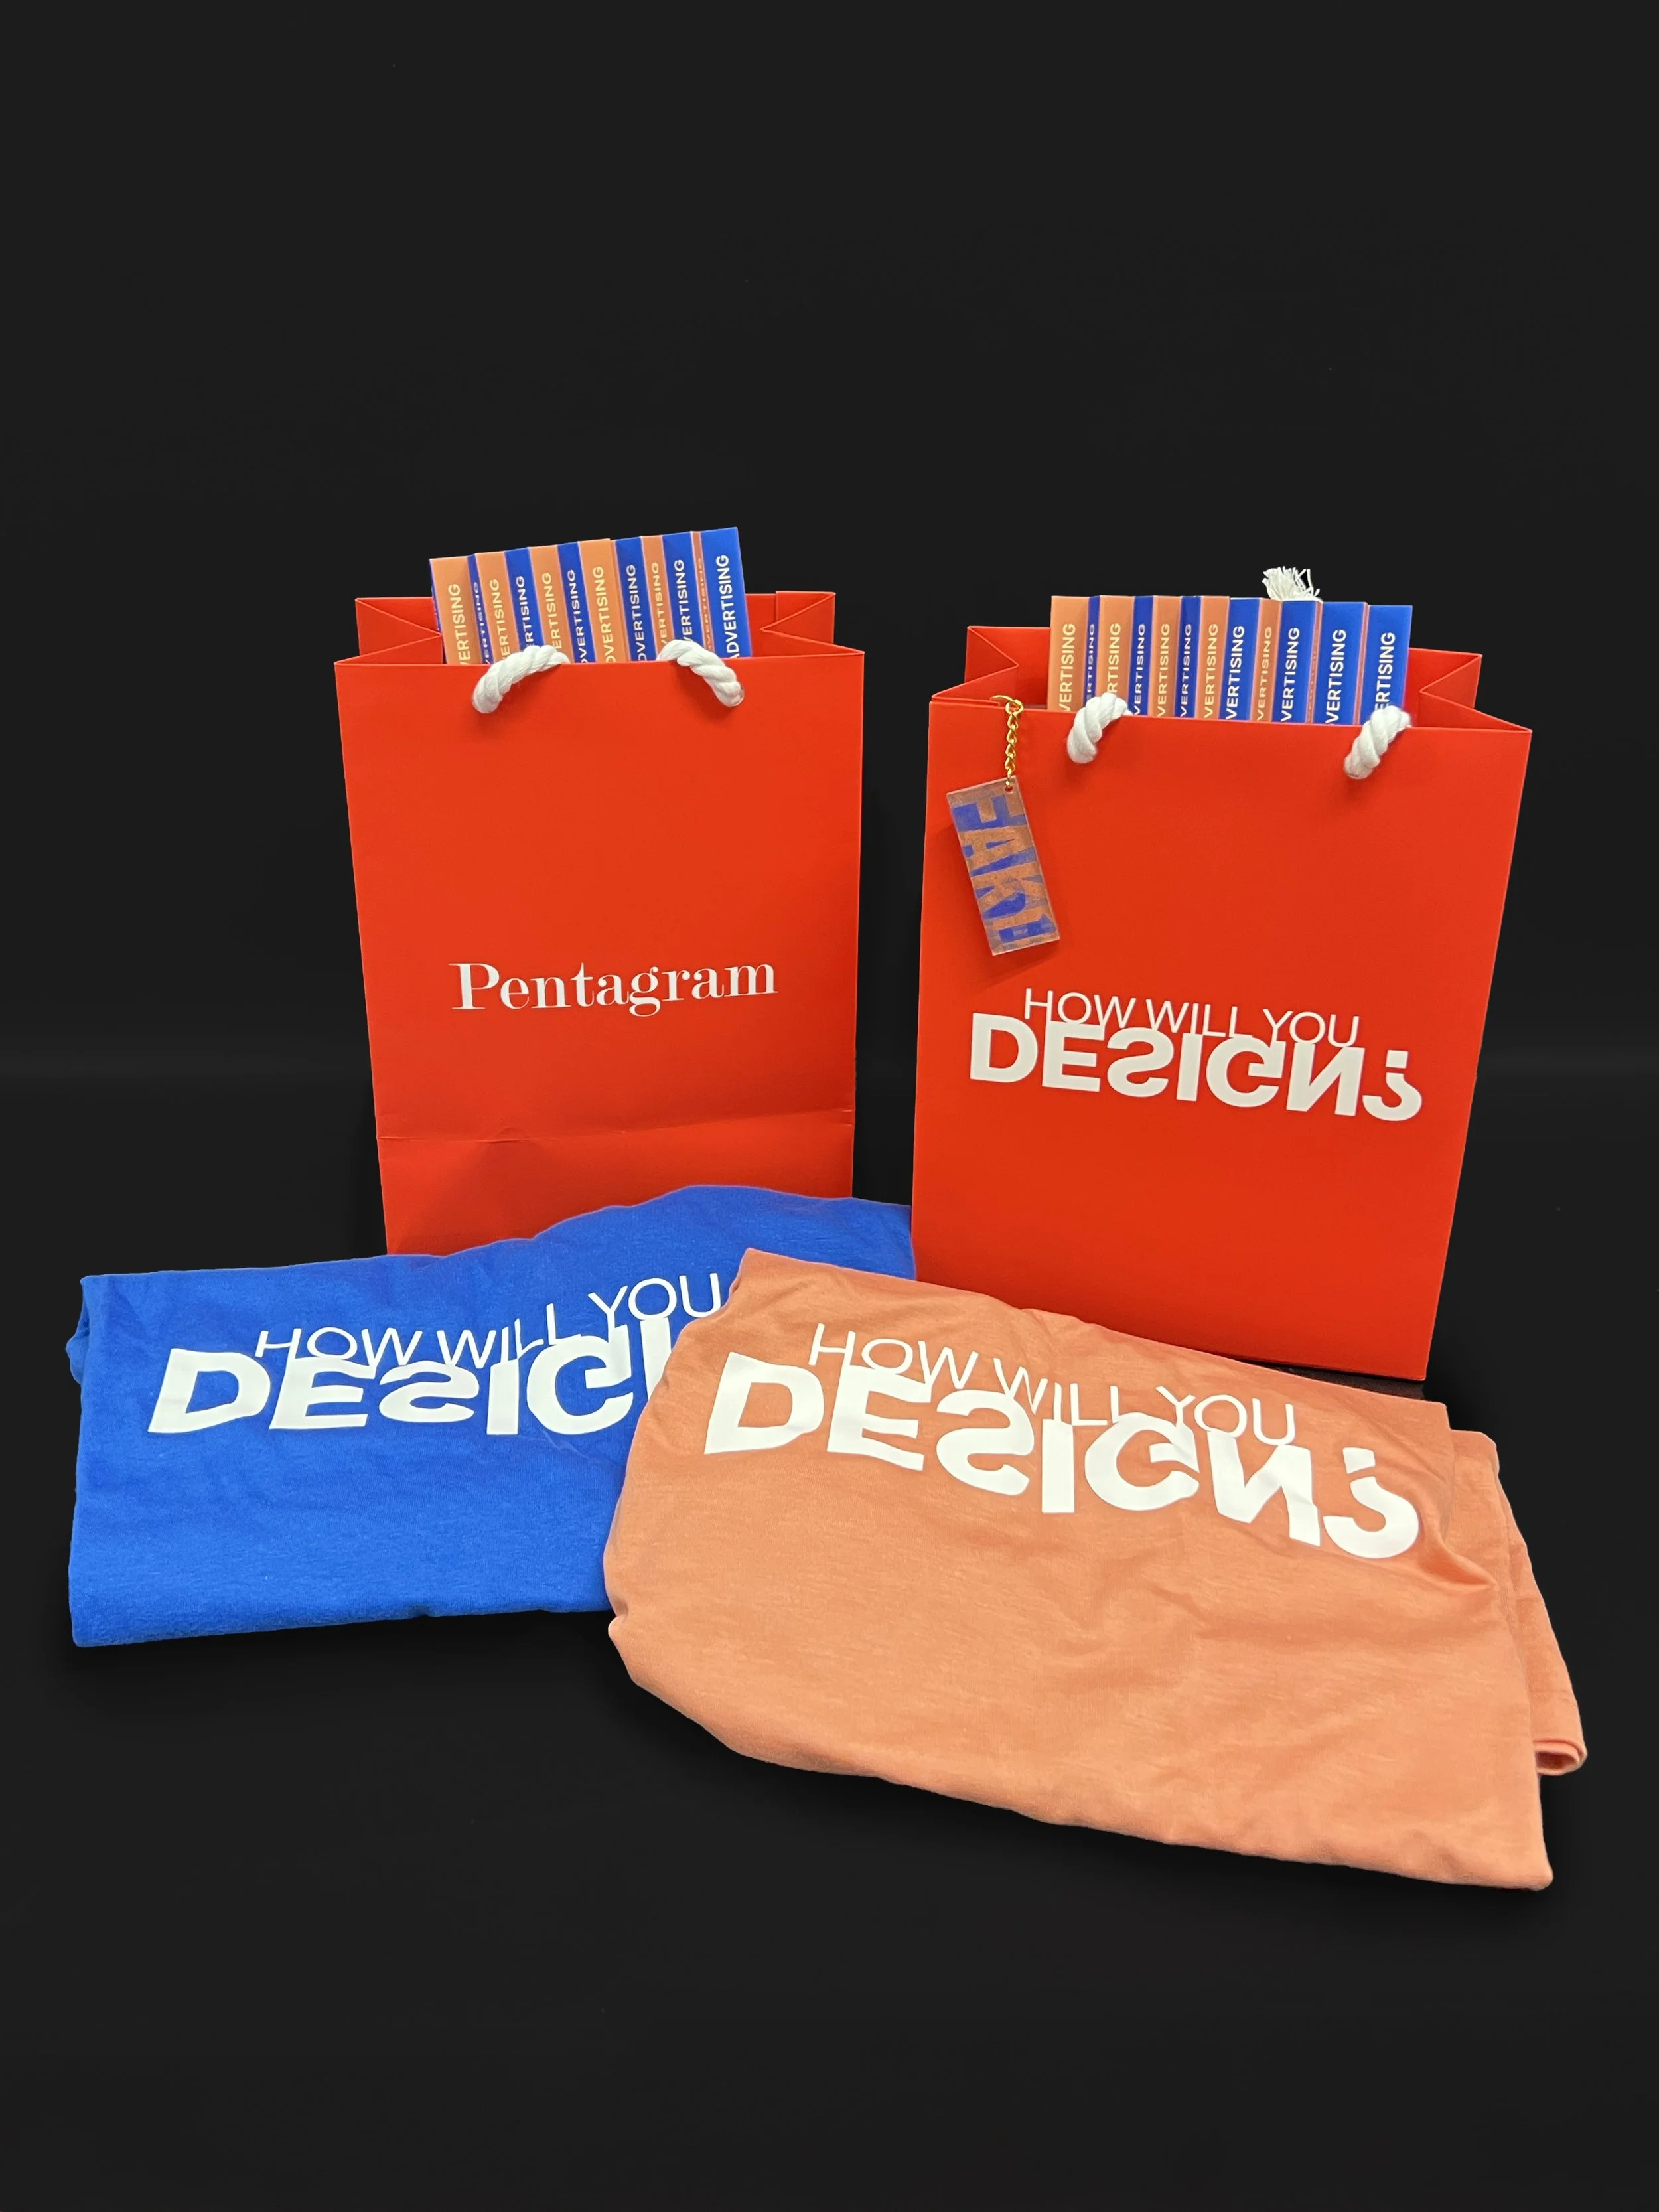
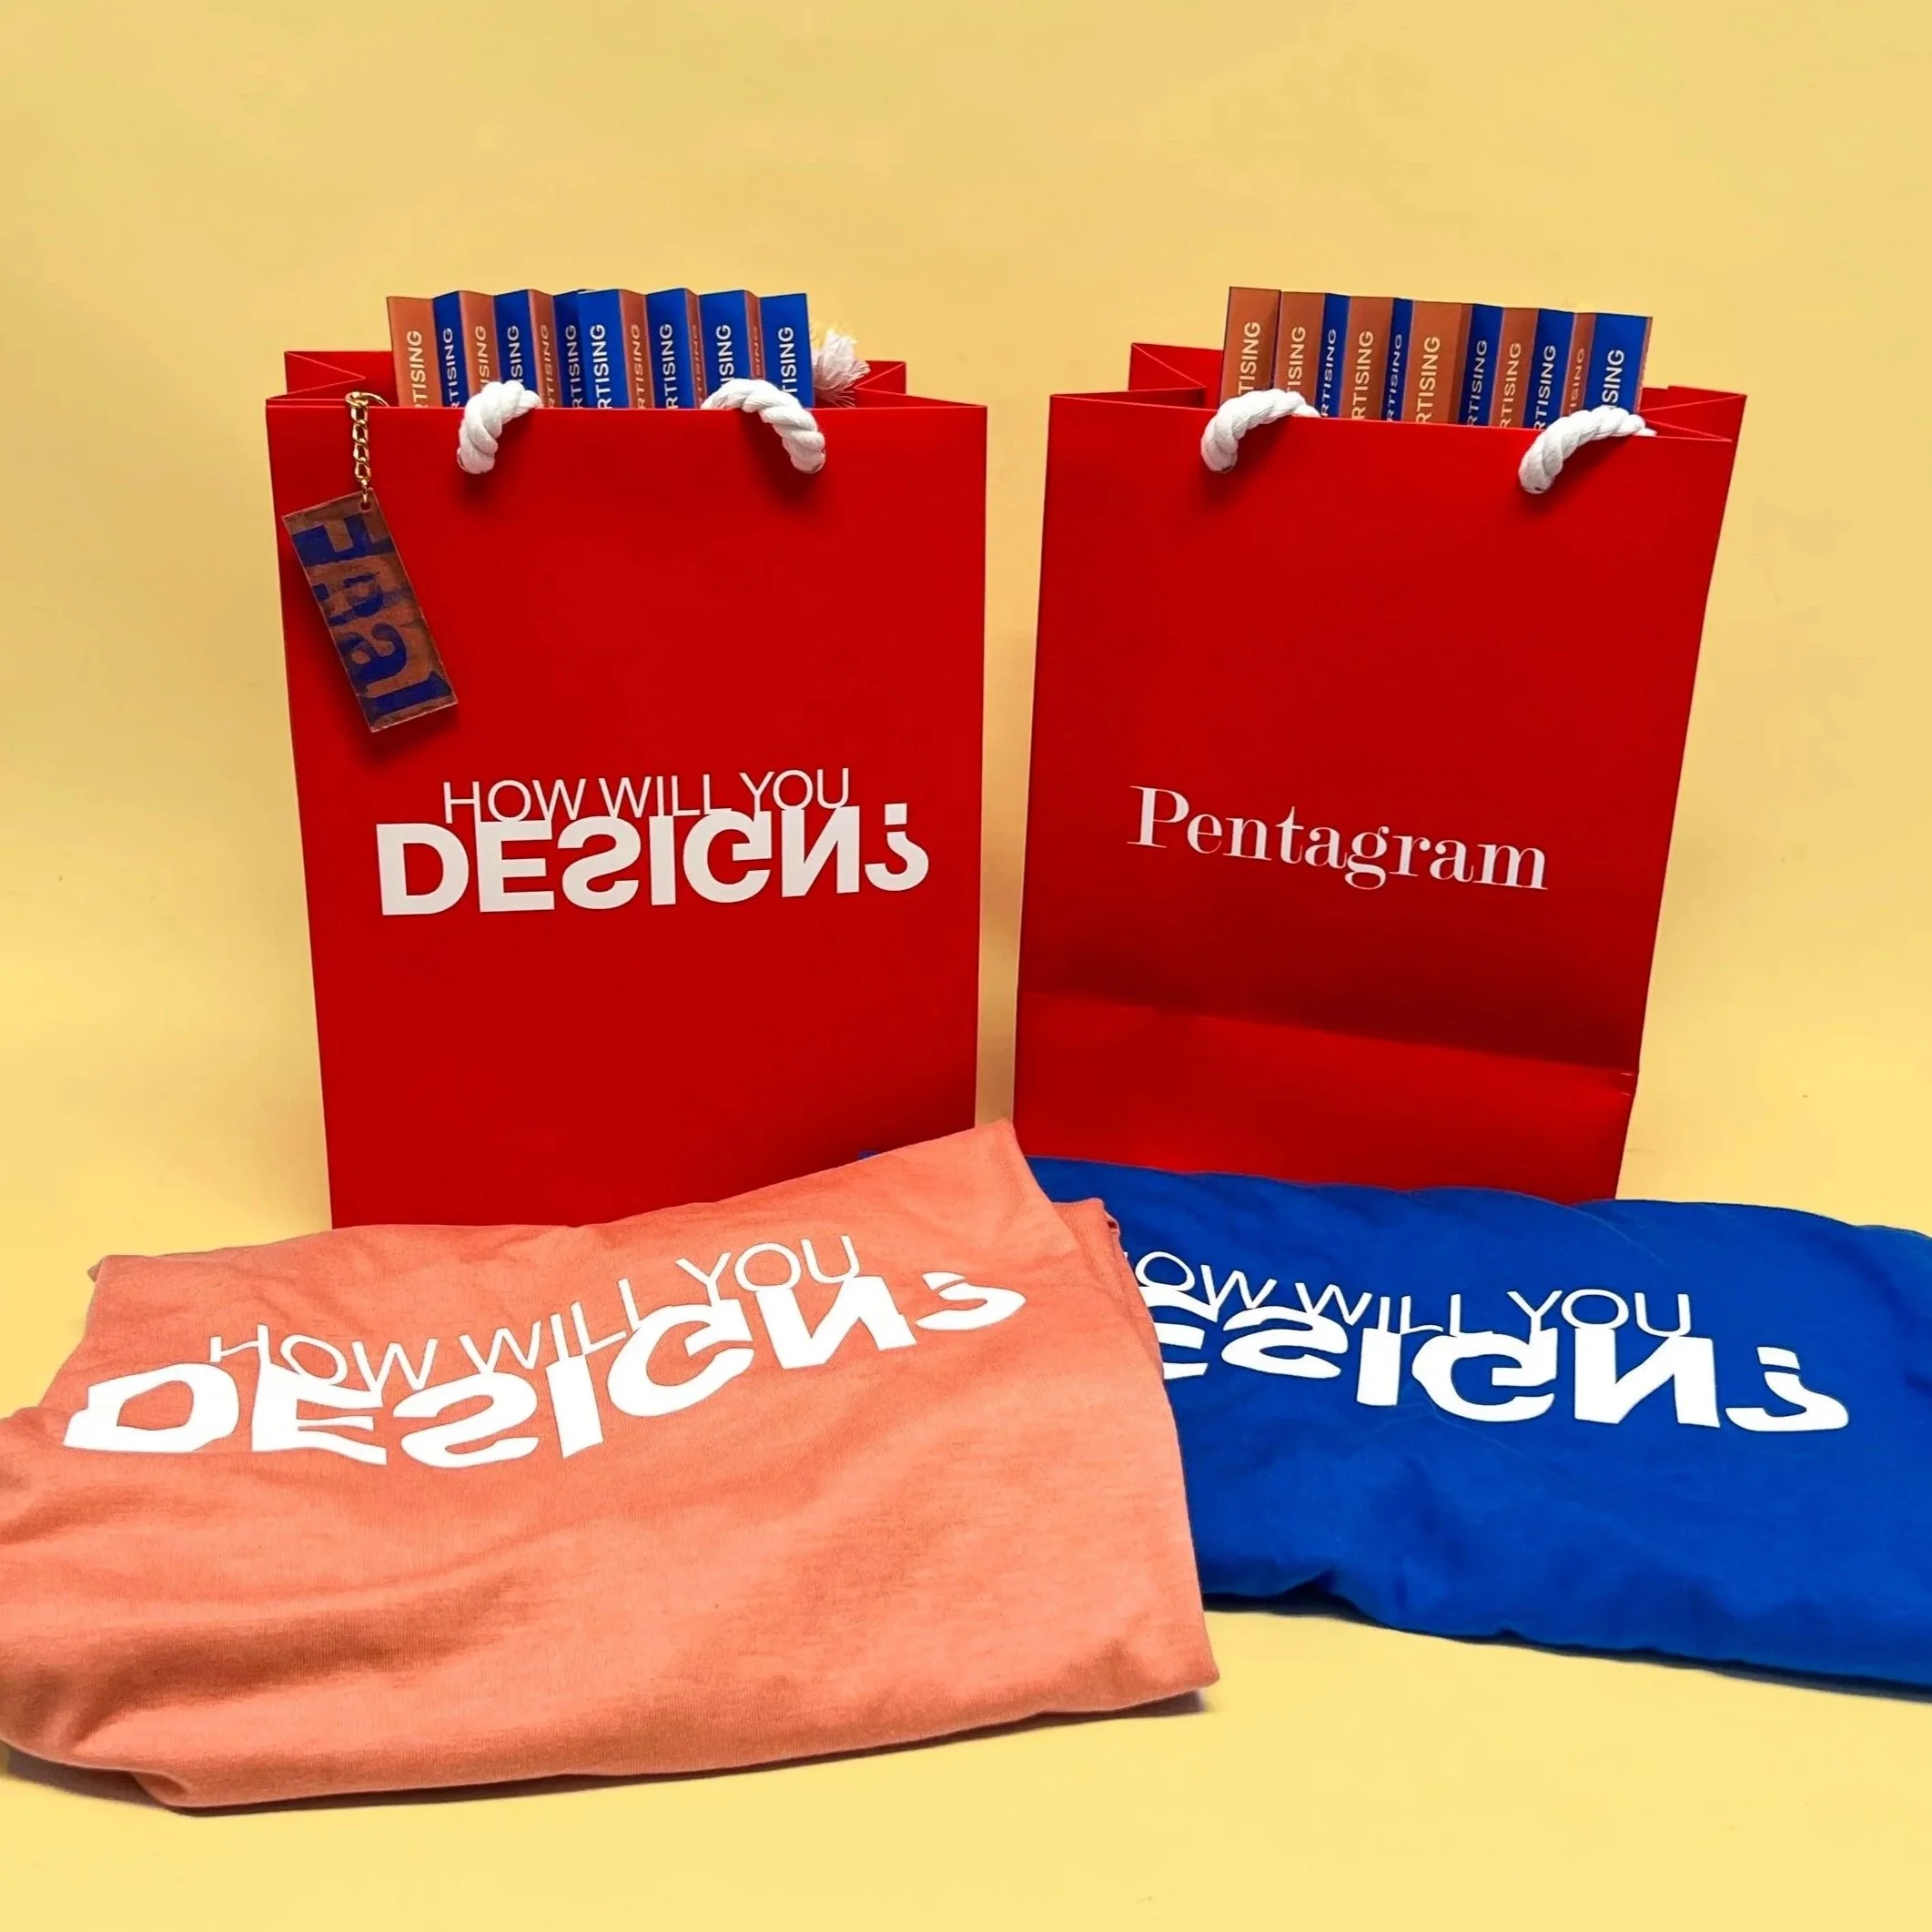
A data visualization system about how audiences respond to AI-generated advertising, designed as a hypothetical Pentagram conference giveaway. It leaves designers with a single question:


The Perception Gap

DATA VISUALIZATION, PRINT

SCAD Project

Objective: Create a data visualization project on AI, art, and creative ownership.

Audience: Designers thinking about whether and how to use AI in their work.


Research

People don't dislike AI ads. They dislike not knowing. Audiences rate AI-made work lower on authenticity and warmth, then respond to it nearly as well as human-made work on persuasion and behavioral intent. The gap between what people feel and what they do is what the project visualizes.

Strategy & Semiotics

Every formal decision carries the human versus AI tension before a single data point is read. Terracotta represents the human: warm, organic, imperfect. Electric blue represents AI: precise, flat, digital. Yellow sits between them as neutral ground. Three typefaces encode voice. Mono45 Headline for machine language, Gelica in lowercase for human warmth, Inter as neutral infrastructure. Human data points are organic and textured. AI data points are clean geometric forms.

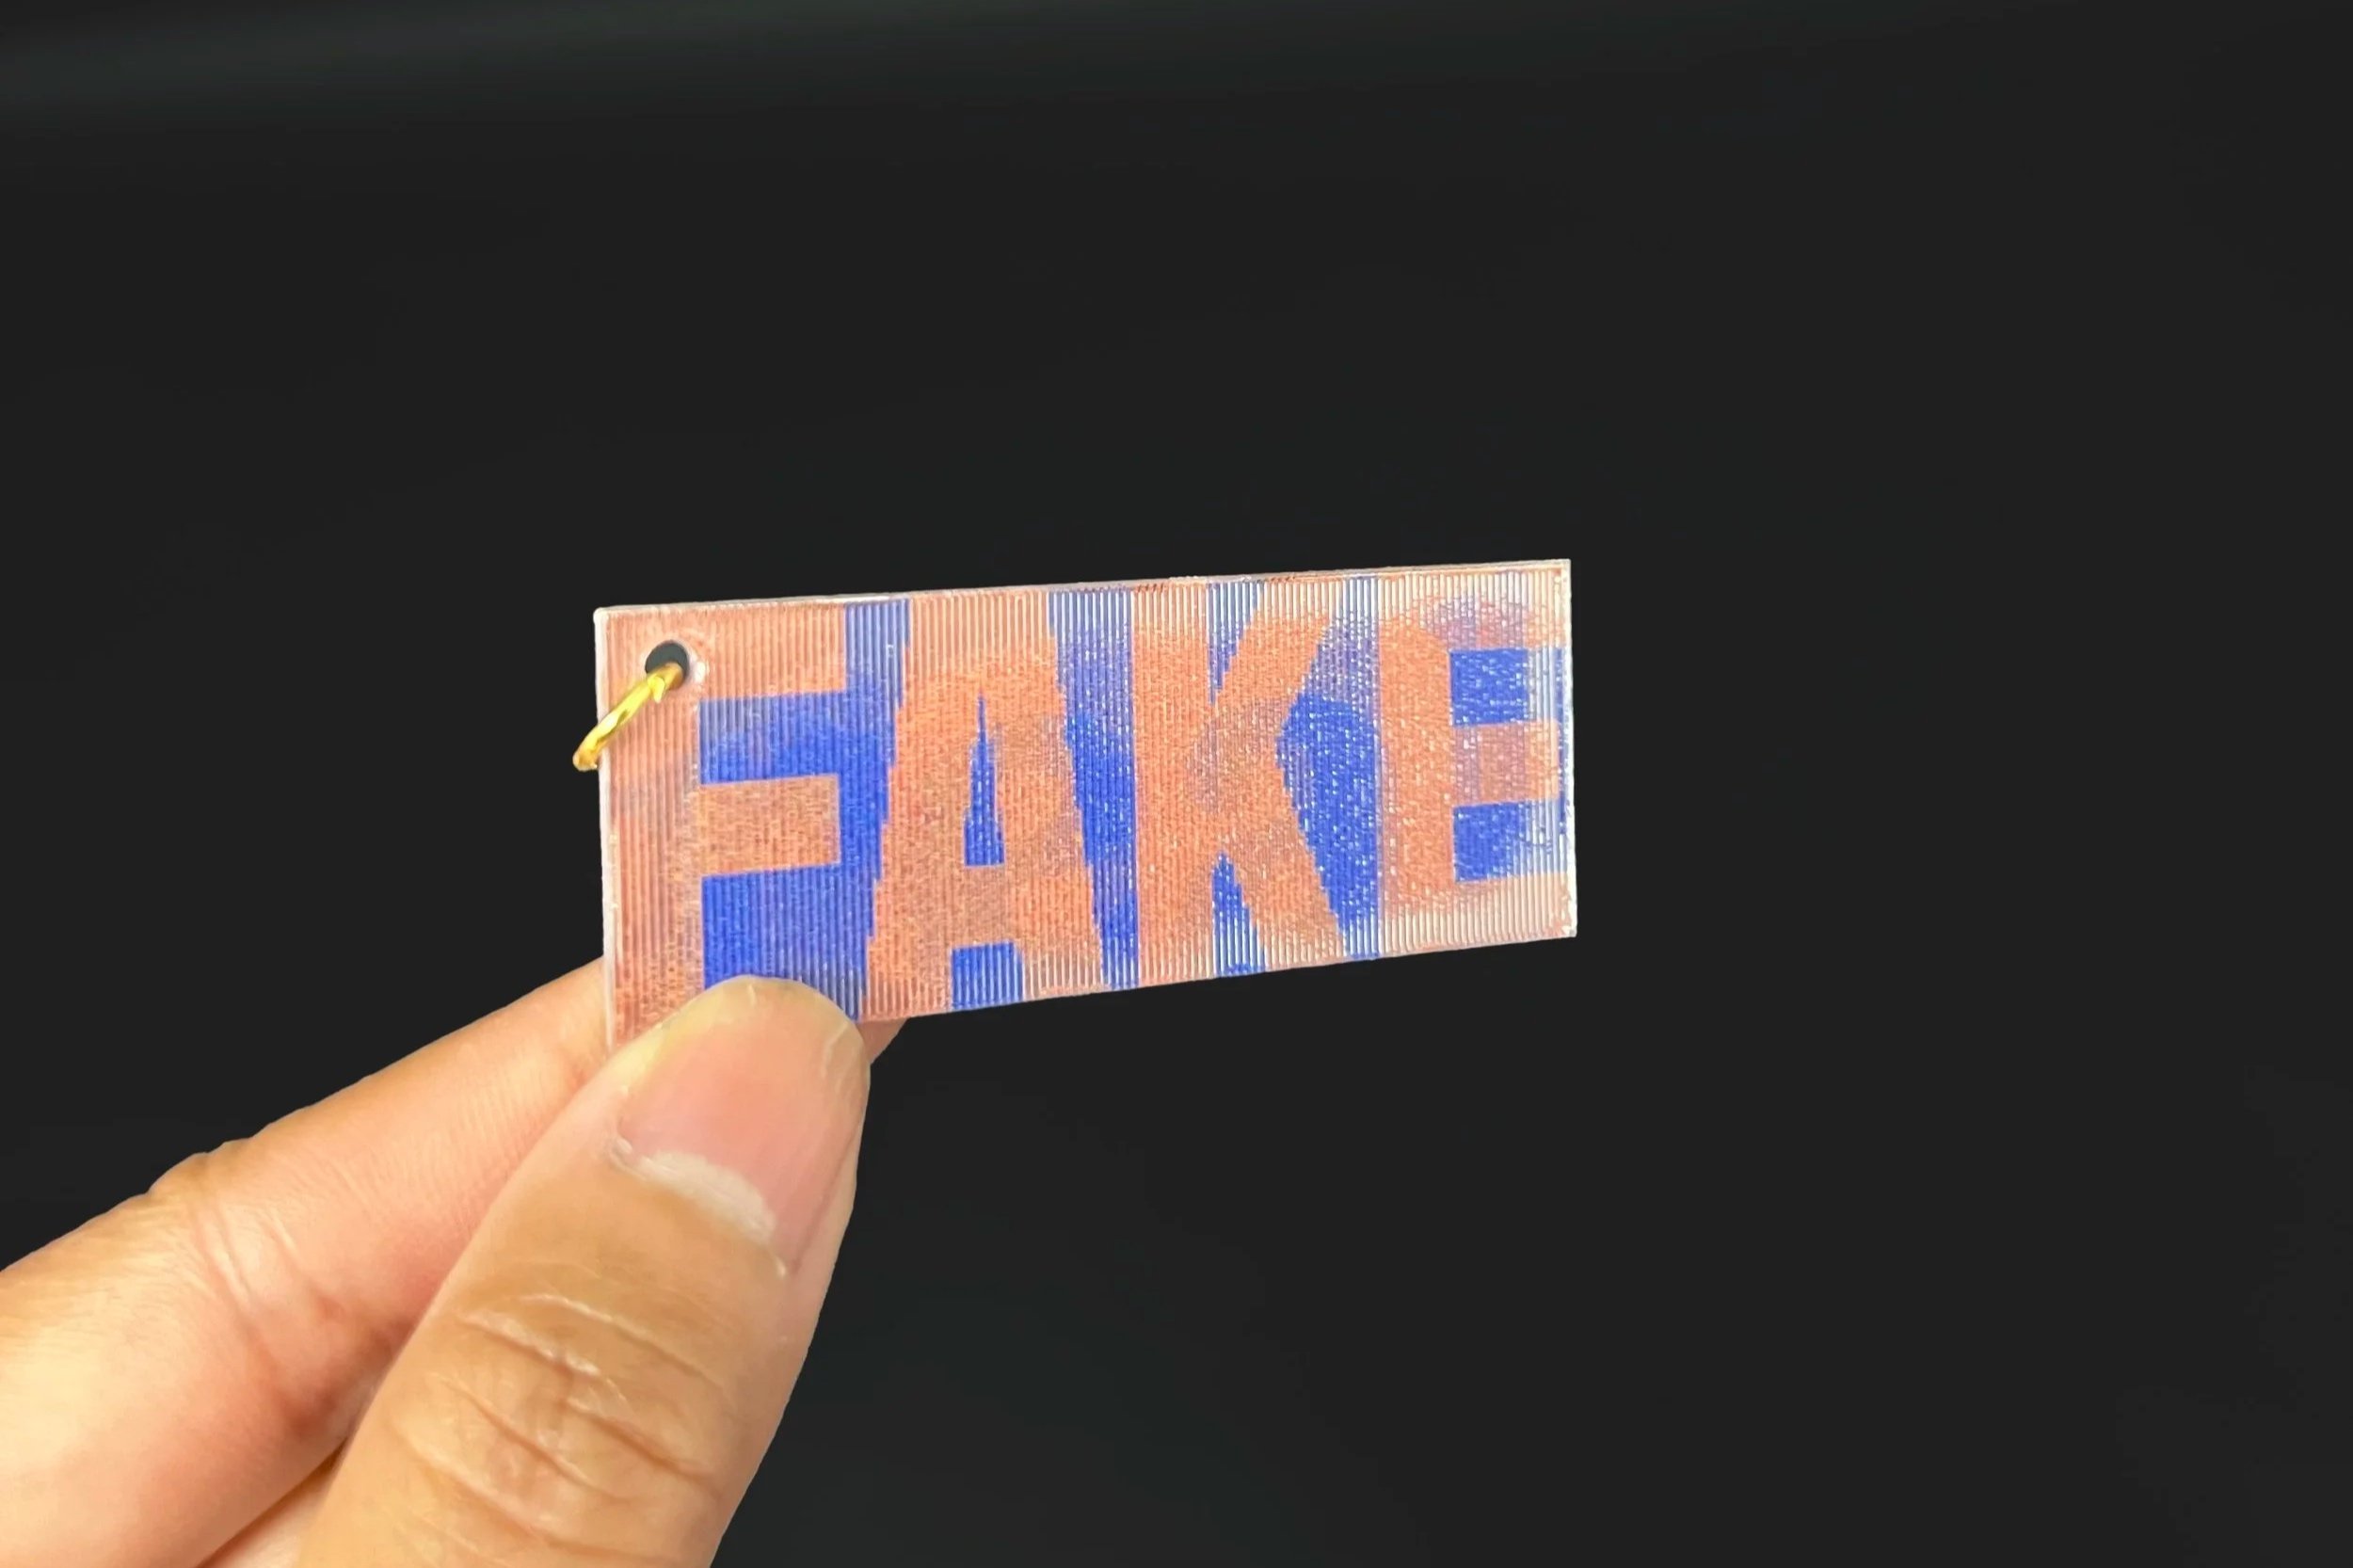
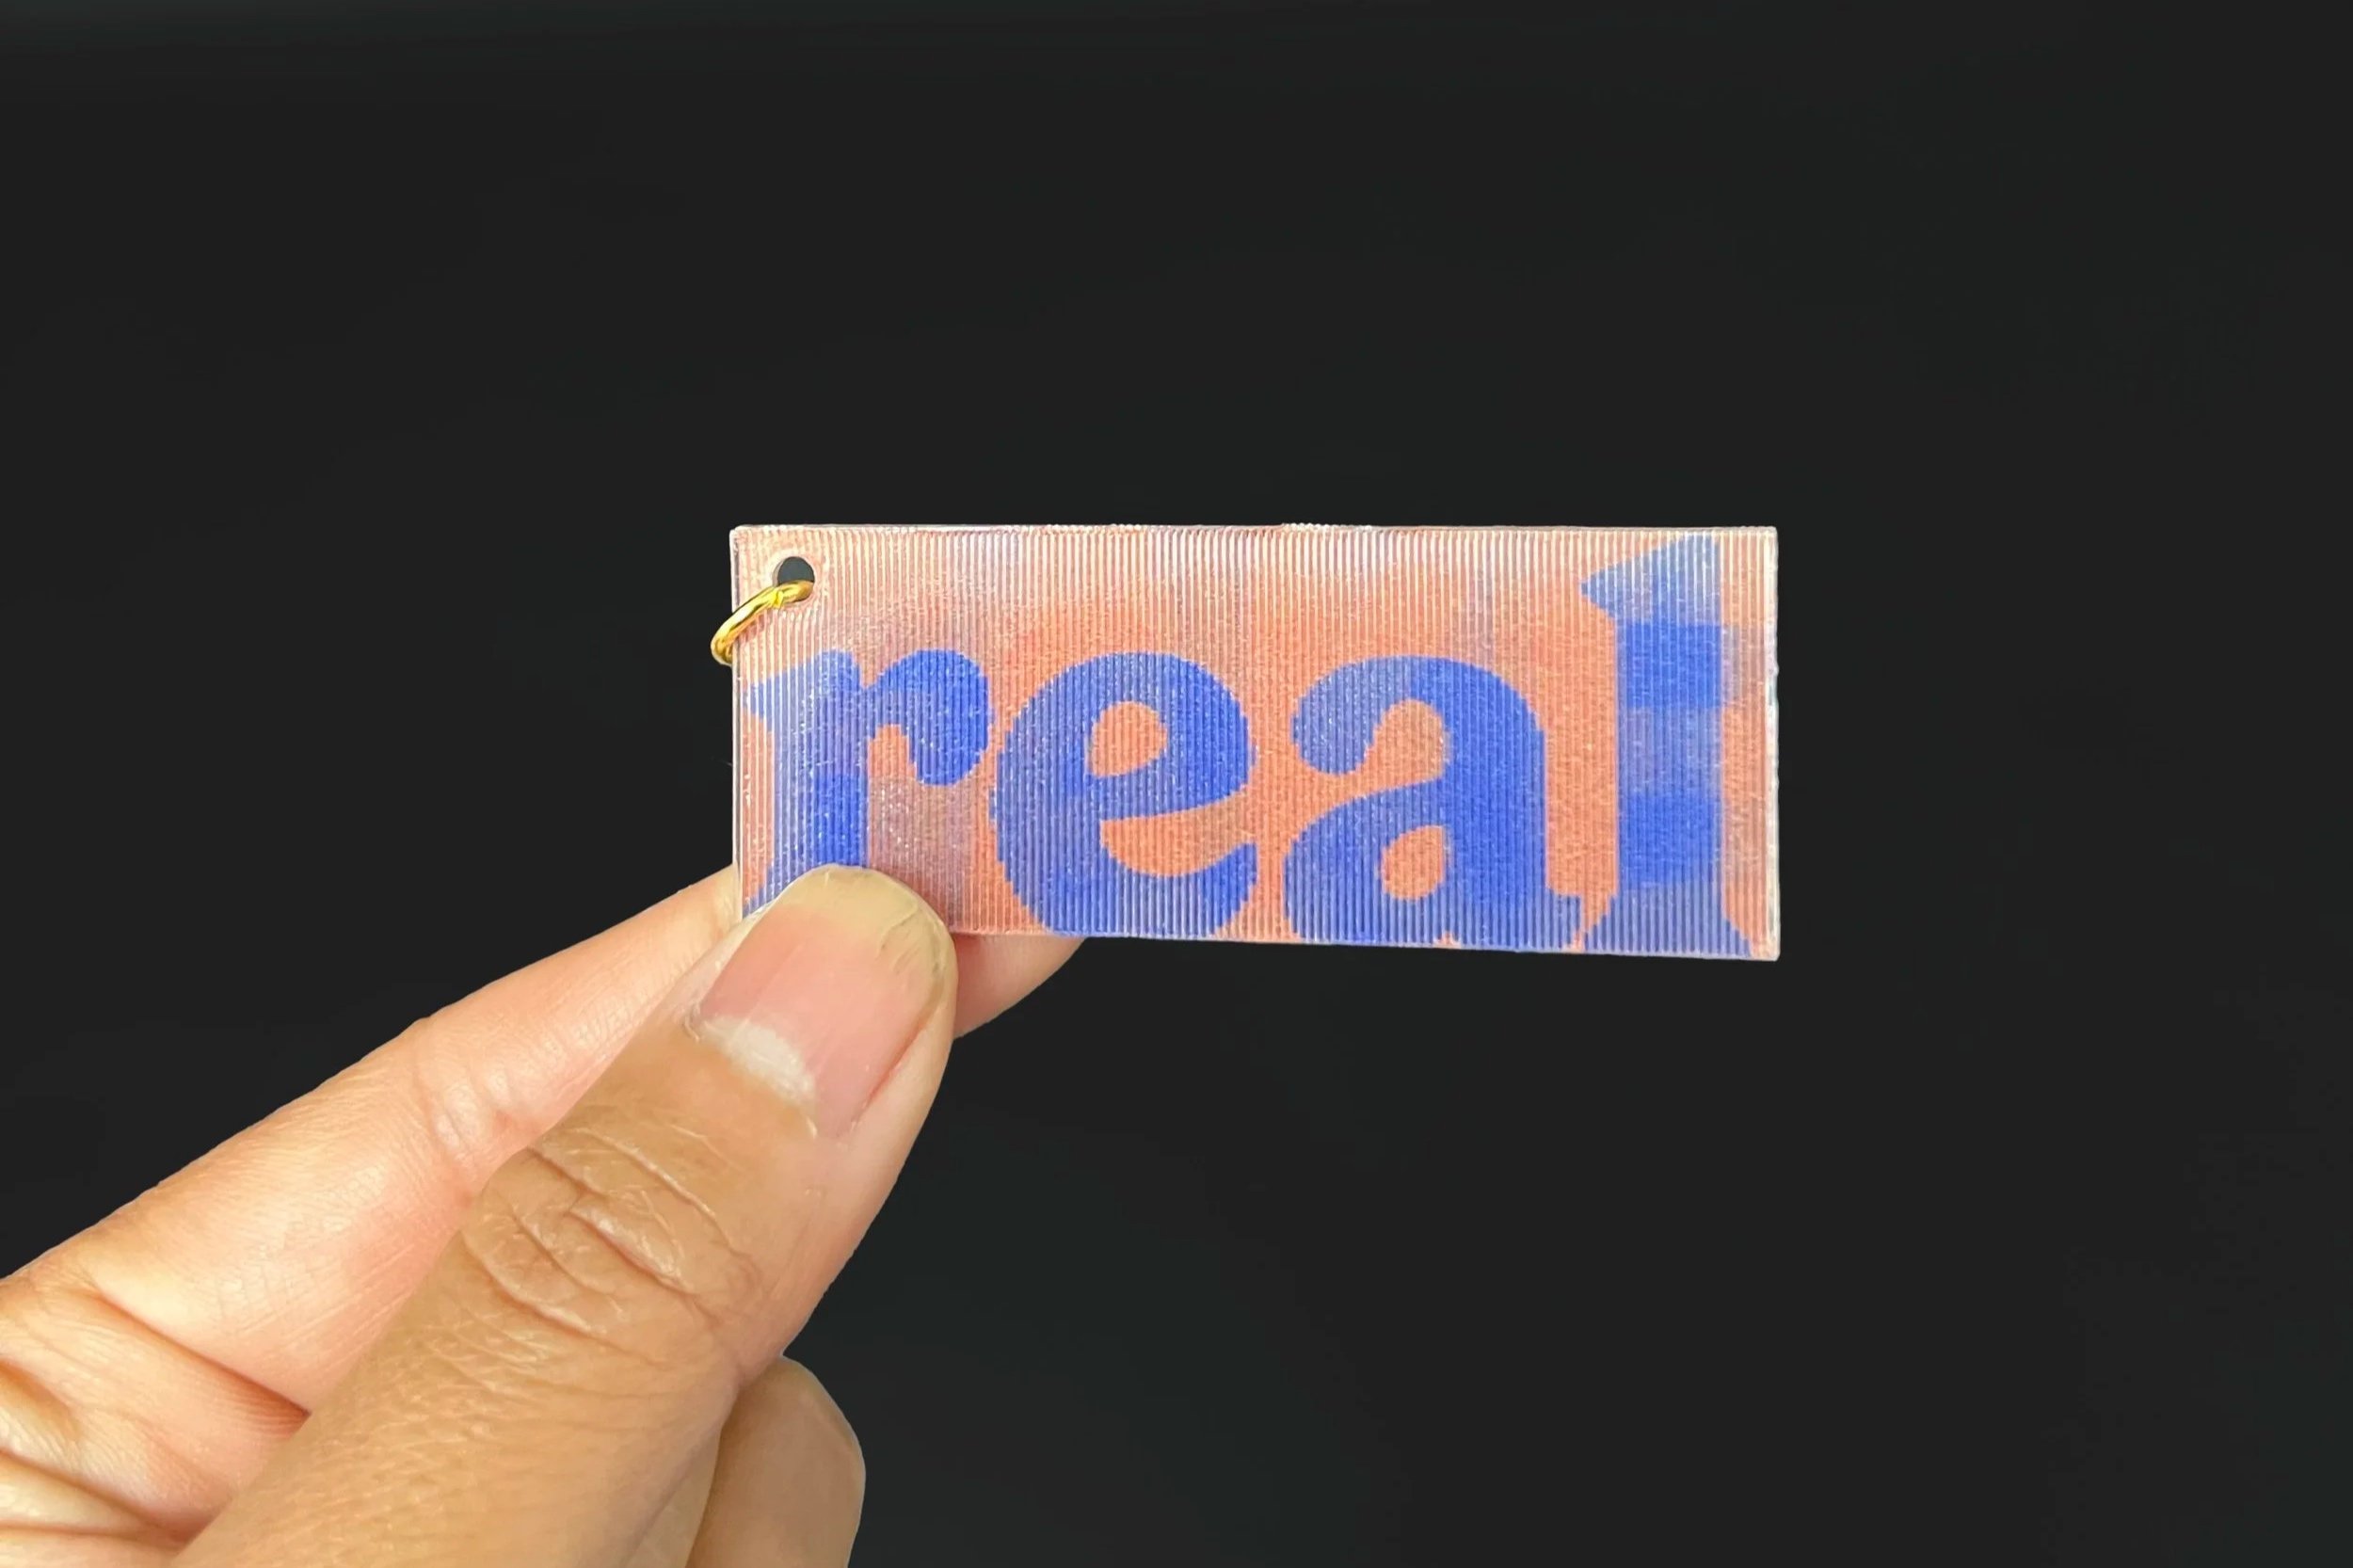
Form extends the concept. A lenticular cover shifts between two readings, then opens through an accordion gatefold to three data panels. That lenticular logic carries into the keychain, a flip between "real" and "FAKE." The system ends on a question: "How will you design?"