Digital Dashboard (2017)
For this project, we were instructed to create a weather static digital dashboard with a targeted audience. I chose to target gardeners, so my digital dashboard needed to include and highlight the most important information that gardeners look for when looking at the weather.
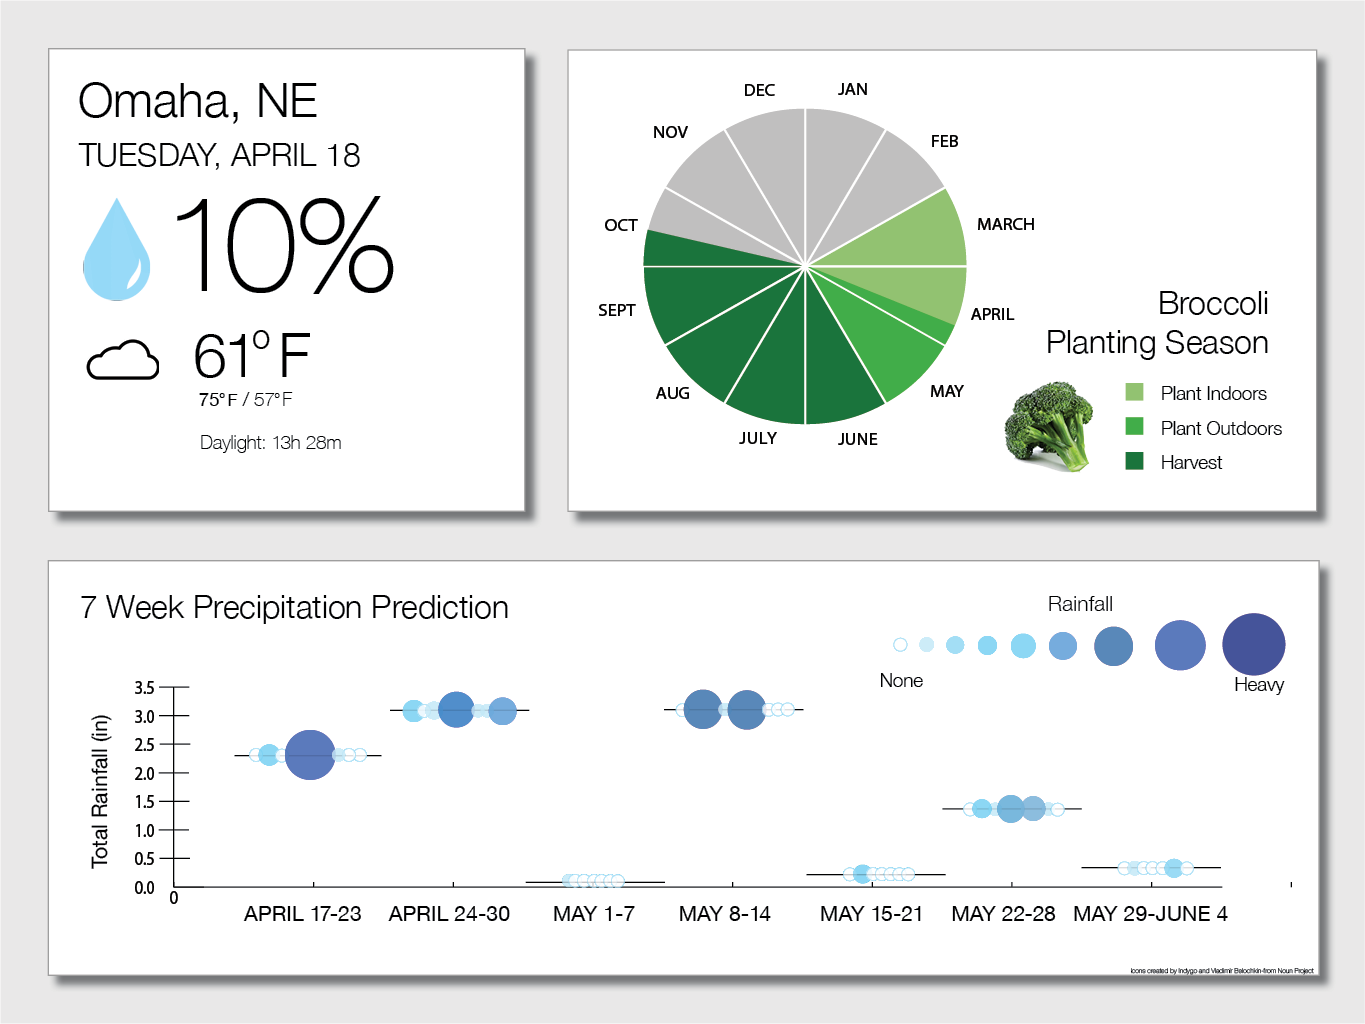
I chose to highlight the precipitation and use a rain drop as an icon since gardeners need to know when it will rain. To expand on the precipitation, I created a visualization of the future precipitation by week so gardeners can plan when they will need to water. By varying size increases and color gets darker, the rainfall will be heavier. I also wanted to show the planting season for a certain vegetable as I thought this would be helpful information for gardeners. I chose to use a pie chart and colors to show the cycle of broccoli season. I decided to have a light grey background to make it easier to read the important information.